


Pajamas Media
The data underlying the famous “hockey stick” global warming graph has finally been found after having earlier been misplaced by leading climate researchers. The newly recovered data confirms the accuracy of the abrupt upward turn in readings characteristic of the “hockey stick” shape found in many global warming projections.
Up until now, however, the data on which the controversial graph had been based was presumed to be lost, so it was not known exactly which aspects of global warming the chart illustrated. Now that the data has been recovered, scientists can state with complete certainty that this updated chart accurately chronicles the past and future trajectory of the global warming crisis.
View the full-size graph by clicking HERE or on the small version shown below:
-------------------------
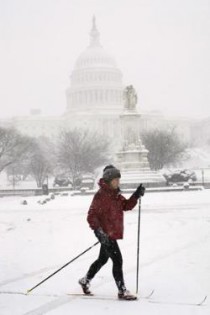
Snowicane - Major Storm Clobbers Northeast
By Joseph D’Aleo
A major nor’easter with hurricane force winds, mountainous snowfalls, flooding rains has slammed the northeast leaving at least 700,000 homes and businesses without electricity. Power failures were so bad in New Hampshire that even the state Emergency Operations Center was operating on a generator. Meanwhile in this upside down storm, it was rain and hurricane force winds in eastern New England with a wind gust of 91 mph at Isle of Shoals near Portsmouth, New Hamsphire and 94 mph at Cape Elizabeth, ME, well above hurricane force of 74 mph. Gusts hit 60 mph or more from New York’s Long Island to Massachusetts.
Public Service of New Hampshire, the state’s largest utility, reported power cut to at least 237,000 homes and businesses and said it would take days before everyone’s lights flickered back on. New York had more than 220,000 customers without power, mostly in the Hudson Valley north of New York City. Maine reported 130,000, Massachusetts 100,000, Vermont 25,000 and New Jersey 11,000.
New York City’s Central Park has had 20.9 inches as of 7 pm Friday, the fourth greatest for any storm in New York City since 1869. It is a new record monthly snow FOR ANY MONTH with 36.9 inches breaking the old record of 30.5 in March 1896.

But up in the Catskills, they hit the jackpot with a 5-day total of 84 inches at Hunter Mountain and 60 inches at Windham. Here is this Friday’s newsletter email from Hunter Mountain.
Good morning from Hunter Mountain!!
We wanted to let you know that we’ve received 60” of snow (they added at least 5 during Friday) in the last 3 days… and we wanted to invite you to come up and shoot some photos, film, or just to see this crazy snow for yourself!
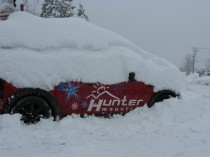
We watched the weather report this morning, and they reported a mere 30” total in Greene County—it made us laugh. There’s more than 5 feet of snow in Hunter, with roadside snowbanks 10-12 feet high.
It’s still snowing here, albeit lightly… but we’re expected to get another 4-8” today as the storm winds its way back and hits us again!
If you’d like to come up, or if you’d like more info on the “Snowicane” of 2010, hit me up! We can certainly make arrangements for you. This is epic snow that has not been present in the area since the 30’s and 50’s—come up and take a bit ol’ bite of snowstorm history here, folks! We’ve had hundreds of die-hard skiers and riders here to ski and ride through this storm!
We hope you’ll consider taking a ride up here… the snow has calmed a bit, the roads are in good shape. For up-to-date info on our operations, visit the Hunterblog. Check our Photo Gallery for some photos from the past few days… our webcams are running as well (we’re working on digging out the summit cam...). As we’ve been telling our fans & followers… come get some!!
See the Bloomberg story on the new monthly record here.
From New York to northern New England Mountains, near or more than 4 feet of snow fell. Sunday, River, Sugarloaf in ME, Stove in VT over 50 inches so far. Another foot or more coming tomorrow in a wrap around storm.
--------------------------
Depth of two-day snowfall remains blanketed in mystery
By By Frank D. Roylance, Baltimore Sun
The blizzard that heaped more than 2 feet of snow on Baltimore on Feb. 5 and 6 was probably the deepest two-day snowfall on record. But we might never be sure how deep it was.
A contractor working for the Federal Aviation Administration at BWI Thurgood Marshall Airport, paid to measure the snow for the aviation industry’s needs, did not follow a separate protocol required by the National Weather Service and the National Climatic Data Center for valid climate data.
So while the contractor measured 28.8 inches of snow during that storm, the National Weather Service has thrown out the reading. Instead, climatologists will rank the storm as “only” 24.8 inches - a number that almost surely understates the “true” total.
Worse, for climatologists, it now appears the weather service’s rules for snow data had been ignored for years at BWI, throwing a cloud over the validity of snow totals as far back as 1998, when the FAA took the job over from the weather service.
Only BWI’s data are known to be affected, but the problem could be more widespread. That possibility has caught the attention of top officials at the FAA.
“We plan to meet with the National Weather Service next week to begin a discussion on making sure that we’re all on the same page in terms of measuring snow accumulations at our airports,” FAA spokesman Jim Peters said. “There will be a national discussion.”
In the meantime, the weather service’s Baltimore- Washington Forecast Office in Sterling, Va., is preparing to convene a committee of climatologists and other experts to review Baltimore’s snowfall records from the 2010 and 2003 storms, and perhaps back to 1998.
“I feel very strongly about historical records and getting the climate data correct,” said James E. Lee, the meteorologist-in-charge at Sterling. “Obviously, with the increased media attention and political attention to climate, it is really up to NOAA [the National Oceanic and Atmospheric Administration, of which the National Weather Service is an agency] to make sure ... the climate record is a genuine one, and consistent to the best of our ability.”
The problem at BWI came to light Feb. 6, as snow accumulations reported at the airport passed 26 inches. They seemed poised to break the record set in February 2003 - the storm listed on Sterling’s Web site as Baltimore’s biggest.
But when reporters called asking about a new record, Lee said that because of measurement errors by an FAA contractor at BWI, the two-day storm total would be pegged at “only” 24.8 inches. He had discarded a 28.8-inch measurement from BWI because it was the sum of hourly measurements throughout the storm - a method invalid for climatological data.
Even at 24.8 inches, Lee said, the storm total beat the previous two-day record of 24.4 inches, set at BWI during two days of the four-day 2003 event. “I’m convinced that was the most amount of snow Baltimore has seen [from a two-day storm] in recorded history.”
But Lee had to use the most conservative reading from the airport - a “snow depth” measurement of the total on the ground when the storm ended, after hours of compaction.
The FAA requires its observers to take hourly snow measurements and wipe the boards clean after each hour, adding the totals as they go. That provides pilots with better real-time information about changing conditions. But it virtually eliminates compaction and so inflates accumulation. Climatologists require measurements every six hours, striking a balance between the hourly and snow depth readings. Some airports maintain separate snow boards for the different protocols. But not BWI.
Richard Carlson, vice president of Pacific Weather Inc., said his company has experienced weather observers at 20 U.S. airports, including eight at BWI. Pacific has held the contract there since 2008.
“We follow the FAA manual ... and that is the guide book on how these meteorological observations are to be taken,” Carlson said. “We had heard about the six-hour measuring thing, but ... if you have high winds at all, this really is not going to work.”
So when Lee questioned the snow data from BWI on Feb. 6, Carlson said, “we informed them [Lee] that we have different criteria, a different manual we are following.” He says the company’s predecessor at BWI also followed FAA rules.
Lee “kept harping back to the six-hour measurement thing,” Carlson said. “That’s meant for climatological purposes, and what we’re doing is operational,” serving the needs of the airport. “He wasn’t real happy.”
Lee wasn’t happy, but there was little he could do. “It’s interesting to have the responsibility for quality control but not the authority to tell the [FAA] contractor what to do,” Lee said.
“In future inspections, this will be raised ... prior to the start of the winter season, to ensure the six-hour swipe is going to be adhered to,” he said.

Shawn Durkin, weather station manager who has worked for Pacific Weather Inc. for 16 years, stands on the rooftop location at BWI where Pacific Weather takes its snow measurements, using a snow board, mounted on the bench to his left, and an 8-inch rain gauge, at right
Read full story here.
Dr. Richard Lindzen’s Talk at FermilabBy The Hockey Schtick
VIEWS ON CLIMATE CHANGE & CLIMATEGATE

Enlarged here.

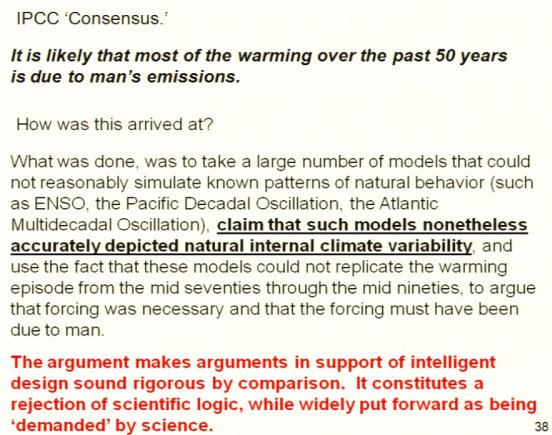
Richard Lindzen PhD, the Alfred P. Sloan Professor of Meteorology in the Department of Earth, Atmospheric, and Planetary Sciences at the Massachusetts Institute of Technology, was recently invited to give a talk entitled “The Peculiar Issue of Global Warming” at Fermilab 2/10/10 which you can watch in its entirety with slides here. Dr. Lindzen calmly eviscerates the theory of catastrophic anthropogenic global warming (CAGW) and the IPCC “consensus”. Highly recommended.
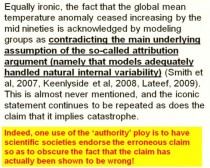
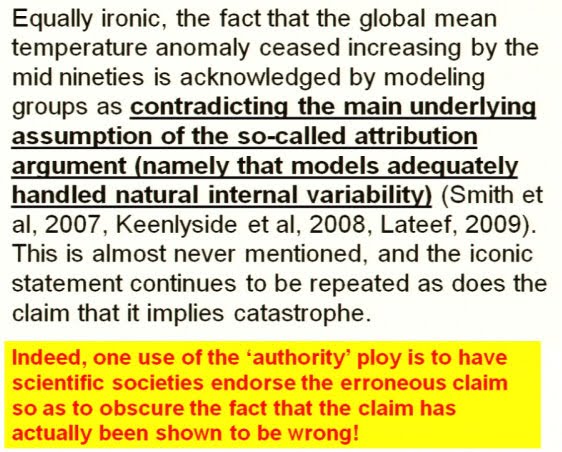
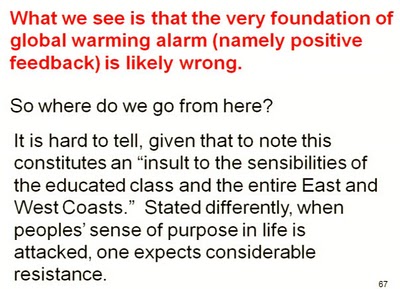
Below are 3 slides from the presentation, the first noting that the theory of intelligent design sounds rigorous by comparison to the theory of anthropogenic global warming, the second noting that 3 pro-CAGW publications have already acknowledged that temperature data has contradicted the man-made attribution assumption (primarily CO2), which is the inherent assumption of the IPCC models, and the third noting that the fundamental assumption of CAGW that there is positive feedback by water vapor due to CO2 is “likely wrong”.

Enlarged here.
Enlarged here.

Enlarged here.
See full blog post here.
By Edward Long, American Thinker
Our study of data-massaging by the U.S. government agency charged with collecting temperature information raises uncomfortable questions.
We have been repeatedly told (perhaps “lectured” is a better word) the past twenty years that global warming is occurring. With Climategate and subsequent confessions and bailouts by scientists at the CRU, Penn State, Arizona State, IPCC, et al., we are learning that little to none of the factual content in their “peer reviewed” articles is true. The Medieval Warming Period did occur, and it was warmer than currently; the oceans are not going to flood the plains; and the Arctic Ocean may not be turning into a summer water park. Of course, the mainstream media, especially in the United States, has reported little of this news, and President Obama appears not to be well-informed. But now the global warming story grows more interesting because here in America, we may have our own little “gate.” I will call it ATG, for “American Temperaturegate.”
NOAA’s National Climatic Data Center (NCDC) informs us, based on their “Adjusted Data” for the period from the last decade of the 19th century to 2006, that the temperature for the contiguous U.S. has increased at a rate of 0.69C/century. Click here. NCDC arrives at this conclusion by massaging raw data from a set of meteorological stations located in the contiguous U.S. which they selected on the basis of a 2.5-degree latitude- and 3.5-degree-longitude grid. For more on this, click here and here. The most-asked question, most recently by D’Aleo and Watts, is whether the NCDC’s reported increase is correct. Perhaps the value is due to a dominant use (over-selection) of stations in urban locations or because of other issues, such as leaving out stations at higher altitudes for the more recent history and retaining them for the more distant past.
Here, one aspect is considered—that of the Urban Heat Island Effect, which is tagged as UHIE.
We selected two sets of meteorological stations (48 each, with one station per each of the lower 48 states) from the NCDC master list. The stations in one set were at rural locations—a rural set. The stations in the other set were at urban locations—an urban set. The NCDC latitude and longitude station coordinates were used to “fly over” the locations on a computer, using a GPS map application to confirm the rural and urban characteristics. For each of the 96 stations, the NCDC’s raw and adjusted temperature data were entered into a spreadsheet application and studied. The “raw” data are the annual average temperatures of the measured data. The “adjusted” data are the annual average temperatures the NCDC derived from the raw data by making a set of “corrective” assumptions for time of day, type of instrument, etc. and guessing the temperature at stations for missing data based on temperatures of other stations at the same latitude and/or region. For a more in-depth understanding of the NCDC protocols for converting raw data to adjusted data, click here. A summary of the findings is in the following table. The values in the table (below, enlarged here)show that the NCDC’s rate of increase of temperature, 0.69C/century, is based on an over-selection of stations with urban locations.
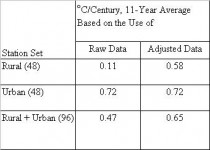
The values in the table highlight four important considerations:
1) The rate of increase for rural locations, based on as-measured (raw) values, is small (if not, in effect, zero) at 0.11 C/century.
2) There is definitely a UHIE in that the urban raw data has a rate of increase of 0.72C/century. This tells us that man has caused warming in urban locations. This finding should not surprise anyone. On the other hand, because the rural value is 15% of the urban value, the UHIE has not caused warming in the rural locations, and it certainly has not caused a global sense of warming other than the aspect that the urban location values when averaged with the rural values produce an average increase which is larger than that of the rural alone.
3) The rural + urban value for the adjusted data, 0.65C/century, is still less than the 0.69C/century published by the NCDC. Thus, likely, there are more urban than rural sites used by the NCDC.
4) And this is the “Temperaturegate” aspect: The NCDC’s massaging—they call it “adjusting”—has resulted in an increase in the rural values, from a raw value of 0.11C/century to an adjusted value of 0.58C/century, and no change in the urban values. That is, the NCDC’s treatment has forced the rural value to look more like that of the urban. This is the exact opposite of any rational consideration, given the growth of the sizes of and activities within urban locations, unless deception is the goal.
The criticism this makes of the NCDC’s treatment of historical data for the contiguous U.S. is the same as a recent Russian paper made of the HadCRUT treatment of historical temperature data for Russia. For a thumbnail of the points made in that paper, click here.
See full Temperaturegate story here.
Edward R. Long holds a Ph.D. in physics. He is a retired NASA scientist who is a consultant on radiation physics for space flight and on energy/climate in the Commonwealth of Virginia.
See full paper on SPPI here and an excellent Watts Up With That blog and discussion with comments here.
By Al Gore
With all the climate deniers spreading lies about the climate crisis in the media, it’s vital we arm ourselves with the facts. Thankfully, Repower America put together a great fact sheet explaining the relationship between the climate crisis and extreme weather:
“Fact: Climate change causes more frequent and severe snowstorms
Record snowstorms need two things: temperatures below freezing, and very high humidity. On a planet warmer by a few degrees on average, the Northeast US will still have plenty of days below freezing; the big difference will be warmer seas producing higher levels of moisture in the air - and therefore more severe cold-season storms.”
“Fact: We can expect more extreme weather
Scientists tell us that climate change has already led to more extreme weather in the United States and we can expect stronger hurricanes, more wildfires, heatwaves and droughts, to name a few.”
“Fact: The world is warming at a quickening pace
Weather in one region over days or months should not be confused with climate or the patterns of weather over decades and centuries. And the science is clear here: the last decade was the hottest on record. And to put this year’s weather in perspective, January was warmer than average for the continental United States”
As usual the Goracle is clueless. He is wrong on all three points. For examples, this winter featured snowmagedden for the Mid-Atlantic states. The longest duration cold ever in Florida and the southeast including snowflakes in Miami and Naples and damage to the citrus. Yes with the January thaw which is strongest and most reliable in the coldest winters, the average for the US for the month was a little above, much of the central and southeast was much below normal. And here is what the winter since December 1 looks like so far.
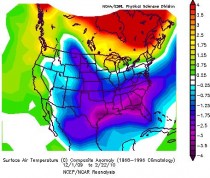
You say one winter doesn’t count and that I am cherry picking. Remember the fact sheet picked one number one month. December was the 14th coldest of 115 years for the US and February will rank similarly. And we have had 3 cold winters in a row. The northern cold and records snows of the last two years were blamed on La Nina and we were promised global warming would return with a vengeance when El Nino came back. Well guess what? It did this past summer and was El Nino was moderate this winter and yet it was colder and even snowier, even in places like the Dakotas and Iowa where El Ninos are typically warm and snowless. Oh and as for the red in Canada that is the result of the 5 standard deviation negative AO which produces blocking high pressure. Temperatures are much warmer than normal in the blocking areas (0 to 10 below instead of 10 to 20 below F) but still cold. Fill in your own expletives.
BTW, thanks to Craig Woods This is thre breakdown of records to date month-by-month this winter. Even with the Urban Heat Island affect, this winter in the United States has seen many more (3X) record low minimums than record high maximum temperatures. (Hat Tip Boris Konon, WSI). Here are the numbers:
December
Record high maximums 264
Record low minimums 1,086
January
Record high maximums 342
Record low minimums 901
February (through 2/24)
Record high maximums 80
Record low minimums 240
-------------------------
Bill O’Reilly hosts Bill Nye The Science Guy and AccuWeather’s Joe Bastardi in Fox News Debate
By Anthony Watts, Watts up With That
Heh, this is entertaining.
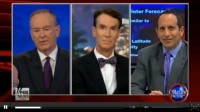
While Bill Nye argues for “in whose best interest is denial?” and brings up the ridiculous CO2 on Venus argument, Joe Bastardi runs circles around him with technical graphs and explanations on forcing factors and their magnitudes.
Warmists scream “weather is not climate!”. We need to shout back “Venus is not Earth!” since the Venusian atmosphere is entirely different in compositions and forcings, and we understand it far less than Earth’s. Icecap note: as commenters said also 26 million miles closer to the sun and days 150 of our days long and has an atmosphere that is denser and deeper with surface pressures 90 times earth producing compressional warming. In the Venusian atmosphere at the same pressure as earth’s, temperatures are comprable to earth. Of course Nye did not mention Mars, where even though its atmosphere is mainly C02, the air is colder because the atmosphere is thin and pressures lower and of course Mars is farther away. See comments for much more.
Meanwhile, Bill O"Reilly seems more concerned about making his commercial break on time than saving the planet.
Nye needs a better argument, as Fox News viewers can see past the appeal to emotion. Bastardi while far more technically competent than Nye, needs to focus on explaining a bit about natural cycles, since few viewers would know what the “PDO” is.
A caveat for both men, doing live TV debate by the seat of your pants is tough. You can’t see each other, and you are communicating via earpiece audio. Live TV is never easy, live via satellite interlinks is even tougher.
Watch the segment => here.
Icecap Note: Agreed TV interviews are no walk in the park. When on tape you have no control over what they use. When you are live, often, as Anthony said, you are unable to see the other parties or the interviewer (I did one interview for a major cable network at a local station from what was no more than a closet with a camera and lighting and no monitor). Often the host keeps interrupting or allows your opponent to go on a monologue (especially with the college professors) with too little chance for you to reply. Sometimes when they give you a few questions to prepare for, they come in from left field with another often oddball question frustrating you because you had in your mind exactly how you were going to reply). Nye proved hand held graphics usually don’t work. The only one that did was the SPPI temperature plot which showed the cooling for a blend of the station data sets and satellite data sets since 2001. Nye followed that with an unintelligible statement to the effect if you leave out 1998, you get a warming. Well I thought 1998 was before 2001. How foolish of me.
---------------------------------
A worldwide fervor over climate change orthodoxy
By Christopher Essex, Toronto Sun
Can you hear me? You’ve been incognizant, but it’s over and you’re going to be OK. Take deep breaths and relax until your vision clears. The world is not going to end because of climate change, at least not in the near future. You are a most fortunate individual. You have been a participant in the biggest inter-dimensional cross rip since the Tunguska blast of 1909! No wait, that’s Ghostbusters.
Let me put it differently: There has never been anything quite like this - ever. The entire world has been embroiled in a persistent, free-floating global fervor (and a really nasty one, too) allegedly based on fervor-less, dispassionate science.
Recently, there was a huge explosion in the climate change orthodoxy factory that was set off by objective evidence we have been deceived and manipulated. The evidence was the leaked e-mails of the University of East Anglias Climate Research Unit (CRU), which are now subject to several official investigations, forcing the head of the CRU to step aside. The e-mails tell a lurid tale of unbecoming, unwarranted, organized and fierce hostility to skeptical climatic researchers, as well as data tampering, anti-scientific secrecy, manipulations of scientific journals, and distortions of peer review that make George Orwell look like a prophet.
This could be dismissed as an isolated case if the CRU were some marginal backwater. But what was produced there was central to the scientific case, such as it was, mounted by the United Nations’ Intergovernmental Panel on Climate Change. The CRU was global warming central! That makes the recent admission by its deposed head to the BBC stunning. He said there was actually no statistically significant global warming for 15 years. That’s contrary to more than a decade of overheated, hysterical rhetoric and news stories, ultimately based in large part on the CRU’s now-discredited positions.
Of course the counter spin was desperate and pathetic: The e-mails were illegally obtained; it was a plot by skeptics/deniers funded by corporations, facilitated by foreign governments; OK, it’s bad, but even putting CRU data aside there’s still “overwhelming” evidence.
This was blown away in the subsequent explosion of pent-up complaints about faulty science that have been hushed up for years by silencing skeptics and likening them to criminals. With new eyes paying attention to the complaints, what was old seemed new.
For example, one IPCC myth was even debunked before it was adopted. In the first, 2002, edition of my book, Taken By Storm, with Ross McKitrick we showed the Himalayan glaciers were not at risk due to global warming. Yet this invention, attributed to the World Wildlife Federation, still appeared, five years afterward, in the 2007 IPCC report. The IPCC author responsible subsequently admitted he put it in to scare people. Finally in 2009, seven years afterward, the head of the IPCC had to answer embarrassing questions about it.
Rule number one: Don’t believe anything you read or hear in the news about ice. Count on it to be a tart up of a pre-tarted position.
So many of these seemingly “new” one-sided “errors” have burst out that unanticipated developments ensued: India threatened to pull out of the IPCC, Greenpeace called for the head of the IPCC’s head, while IPCC stalwarts rushed to distance themselves from the IPCC.
It’s been like watching the conclusion of a classic Bond movie where an enormous explosion consumes Dr. No’s fortress. The serious damage of the great fervor was not from these noisy secondary cultural explosions. It was from the sustained, immoral attacks on scientific skepticism and skeptical scientists. The attacks began the moment science became subordinate to policy.
That is corruption of science, and we will all eventually suffer if it is not consciously stopped. Read more here.
Dr. Christopher Essex is a professor of applied mathematics at the University of Western Ontario and co-author of Taken by Storm: The Troubled Science, Policy and Politics of Global Warming
Pro: Climate change is real; there is no debate
By Walter C. Oechel
Sunday, February 21, 2010 at 12:01 a.m.
The message from five decades of scientific research, the public-at-large and even most politicians is clear: Climate change is real and we must act now. Our future health, economic well-being and national security are at risk if we don’t.
“But what about the debate?” There really isn’t one. The following are facts:
Carbon dioxide is a greenhouse gas that acts to warm the planet.
Carbon dioxide is being emitted from fossil fuels by human activity.
The amount of carbon dioxide emitted from fossil fuel use is increasing.
The climate is getting warmer, more unstable, and the climate extremes are greater.
This can only be adequately explained by including human carbon dioxide emissions.
More than 90 percent of the U.S. and international scientific communities agree that while there has always been climate variation, the recent historic warming is due to human activities, particularly from fossil fuel overuse.
I have been working in the area of global warming, climate change and the impacts of increasing atmospheric carbon dioxide for more than three decades. The critical scientific issues were quite well understood 30 years ago but public dissemination of relevant information and appropriate new policy have been thwarted by media laziness, the loss of the Fairness Doctrine in broadcasting and a disinformation campaign funded in part by elements of the fossil fuel industry.
As a false debate raged, we lost valuable time that could have been used to develop technologies and approaches to lower carbon dioxide emissions and increase energy efficiency. Instead, the United States has increased its reliance on foreign-supplied fossil fuel. As we now move slowly toward energy efficiency, we are behind the curve in comparison to other countries but still have the potential to become a leader in renewable technologies. We need to act quickly and effectively to help slow the effects of climate change, gain market-share in renewables, reduce foreign debt and reduce our reliance on insecure foreign fossil fuel markets.
A rarely discussed factor affecting our global health and climate stability is population growth. The world population is increasing by more than a billion people every 15 years, and on average each person is emitting more carbon dioxide. Between 1990 and 2007, as obfuscation and debate regarding climate continued, world population increased by 9.8 percent and per-person carbon dioxide emissions increased by 25 percent. These two factors resulted in an increase of total fossil fuel emissions by 38 percent.
Americans have often faced challenges that have brought about innovation and success. The opportunity to create a long-term and forward-thinking economy based on green technologies is within our reach and includes solar homes and electric cars using renewable energy. We should work with other nations in promoting education and health, which will help slow population growth. With the data collected by scientists, the tools developed by a growing green energy sector and the workforce trained in math, science and engineering to implement these new technologies, we have an opportunity to boost our national and global economy and mitigate the effects of climate change. We have no other choice but to work together globally to avert long-term global climate disaster.
Oechel is professor of biology and director of the Global Change Research Group at San Diego State University.
-------------------------
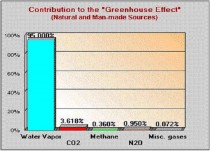
Con: Denialists say it’s all about the water vapor
By Jack Henderson
Sunday, February 21, 2010 at 12:01 a.m.
First, to set the record straight, examination of ice core samples from the arctic shows that cyclical global warming and cooling has been going on for hundreds of thousands or even millions of years. It is the sun’s emissions that provide the heat, and greenhouse gasses trap that heat, warming the Earth. As the sun goes through cycles of more or less emission, the Earth goes through cycles of warming and cooling.
Water vapor is Earth’s most significant greenhouse gas. About 95 percent of the greenhouse effect is from naturally occurring water vapor, and about 5 percent of it from other gasses. Of the other gasses, carbon dioxide is about 3 percent. Of that portion, about half is man-made.
Former Vice President Al Gore touched off the man-made global warming hysteria. His error-filled movie persuaded many that people are responsible for global warming. The subsequent award of the Nobel Prize led to many scientists and nonscientists becoming disciples of the prophet Gore.
In order to get funding and notoriety, these acolytes deliberately excluded water vapor as a greenhouse gas in their analyses. And, in fact, leaked e-mails show that there was collusion by climate scientists to skew scientific information in favor of man-made global warming.
In a December letter to The San Diego Union-Tribune, two distinguished scientists from the Scripps Institution of Oceanography wrote “the denialists are never held to the same standards but are allowed to present their charges as if they carried the same weight as published research.”
To the contrary, a multitude of publications from prestigious institutions, and dating from the 1950s to current time, present data including water vapor. One notable quote is from S. Fred Singer, atmospheric physicist professor emeritus of environmental sciences at the University of Virginia: “I can only see one element of the climate system capable of generating these fast, global changes, that is, changes in the tropical atmosphere leading to changes in the inventory of the earth’s most powerful greenhouse gas - water vapor.”
And from Wallace Broecker, a leading world authority on climate at Lamont-Doherty Earth Observatory, Columbia University: “The ability of humans to influence greenhouse water vapor is negligible. As such, individuals and groups whose agenda it is to require that human beings are the cause of global warming must discount or ignore the effects of water vapor to preserve their arguments.”
The question for the Scripps professors and the Gore disciples is simply, how do you account for water vapor?
Carbon dioxide is relegated further down on the list by recent reports that tell of the presence of previously unknown sources of methane. Methane is a greenhouse gas some 25 times more powerful than carbon dioxide at trapping heat. It is bubbling up from the Arctic Ocean floor. Over the past couple of decades, researchers have documented about 90 oceanic locations of methane hydrate, estimated to contain as much as 63,000 gigatons or more of carbon. As the ocean warms, more and more methane will be released from the ocean floor and eclipse the effects of carbon dioxide.
President Barack Obama and Secretary of State Hillary Clinton are pledging to provide billions of dollars for other countries to cut down their carbon emissions. Wouldn’t it be better to spend those billions by helping those put in need because of global warming? Icecap Note: or because of misguided government policies.
See the debate story here.
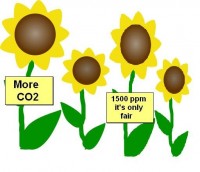
CO2 has been a boon to vegetation and enabled us to feed many millions more people
or seen in experiments here.
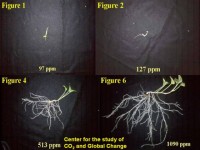
Greenhouses know this and actually many pump 3 times the ambient air CO2 into the greenhouses to produce a more vigorous plant growth, CO2 reaches levels up to 5 or 10 times higher in crowded auditoriums and malls, 30 times higher in submarines with no ill effect. CO2 is not a pollutant but an essential plant fertilizer. It has little or no effect on global temperatures. As both Singer and Broeker say, its all about water vapor and satellites and balloons say it is not increasing. The governments and environmentalists don’t talk about water vapor because there is no way to make money off of it. They can’t tax the hydrological cycle or prevent you or the soil and oceans from evaporating water vapor or trees transpiring it. They can and have tweaked their climate models to show water vapor increasing as CO2 increases, but as noted that is not the case. This is why their climate models despite their best efforts to manipulate temperatures to appear otherwise are failing miserably.
Patrick J. Michaels, George Mason University
Michael Mann’s Dec. 31 Letter to the Editor, “Science Journals Must be Unpolluted by Politics,” states that I falsely claimed that work by me and “other fossil-fuel-funded climate change contrarians” has been “unfairly blocked . . . from appearing in mainstream science journals.”
In fact, this started nearly 20 years ago, when Stephen Schneider, the editor of Climatic Change, rejected a manuscript of mine reconstructing upper-air data, saying that its “counter-paradigm” nature required that it be subject to more vigorous peer review than other submissions.
Prof. Mann claims that other “skeptics” (whatever that means), such as University of Alabama’s John Christy, have “no problem” with the mainstream journals. Prof. Christy recently documented a remarkable series of publication irregularities directed against him and other scientists, revealed in the climategate emails.
Recently, Roger Pielke Jr., director of the University of Colorado’s Center for Science and Technology Policy Research, noted a series of “effort[s] by activist climate scientists to stage-manage the peer review process much like how one might manage a partisan blog for public consumption.” One of his sources is again climategate, which is rife with threats to boycott a journal that dared to publish papers that Prof. Mann and his friends disagreed with.
In passing, I would note that the University of Virginia, where I worked for nearly 30 years, has rather rigorous standards for promoting scientists like myself through the academic ranks. Instead, Prof. Mann cites President Barack Obama’s science adviser John Holdren as an authority on my work, all the while arguing for keeping science “unpolluted by politics”!
Read more here.
---------------------------
Global Warming Meltdown
By KUSI’s John Coleman
Global Warming: Meltdown digs deeply into the strong differences of positions about global warming; It answers the negative responses by several key institutions to our first global warming telecast in January. See the special in 9 parts here.
The “Climategate” revelations that began in mid December have crescendoed into a series of almost daily embarrassments for the UN IPCC. This telecast covers as many of them as we can cram into an hour. The program can be viewed in segments. With the intro to each segment you will find links you may use to find more information on the topics covered. If this is the first time you are hearing about my efforts to debunk the bad science behind the global warming frenzy, you will find a wealth of information, videos and links to sites on the colemanscorner page here.

*The first program “Global Warming: The Other Side” can be viewed here. See the SPPI paper featured in it here.
--------------------------
The sound of alarm
By Dr. Richard Lindzen, MIT letter to Boston Globe
February 19, 2010
Kerry Emanuel’s February 15 Boston Globe op-ed ”Climate changes are proven fact” is more advocacy than assessment. Vague terms such as “consistent with,” “probably,” and “potentially” hardly change this. Certainly climate change is real; it occurs all the time. To claim that the little we’ve seen is larger than any change we “have been able to discern” for a thousand years is disingenuous. Panels of the National Academy of Sciences and Congress have concluded that the methods used to claim this cannot be used for more than 400 years, if at all. Even the head of the deservedly maligned Climatic Research Unit acknowledges that the medieval period may well have been warmer than the present.
The claim that everything other than models represents “mere opinion and speculation” is also peculiar. Despite their faults, models show that projections of significant warming depend critically on clouds and water vapor, and the physics of these processes can be observationally tested (the normal scientific approach); at this point, the models seem to be failing.
Finally, given a generation of environmental propaganda, a presidential science adviser (John Holdren) who has promoted alarm since the 1970s, and a government that proposes funding levels for climate research about 20 times the levels in 1991, courage seems hardly the appropriate description - at least for scientists supporting such alarm. See letter here.
Richard S. Lindzen
Cambridge
The writer is Alfred P. Sloan professor of atmospheric sciences at the Massachusetts Institute of Technology.
See his video interview for Copenhagen and John Coleman here.
By Dan Weil
New research from multiple scientists indicates the case for global warming isn’t as strong as some would have it.
The United Nations Intergovernmental Panel on Climate Change (IPCC) recently declared that “unequivocal” evidence shows human pollution is driving temperatures up.
It says the global temperature already has risen by 0.7 degree centigrade thanks to greenhouse gases. And it predicts another five to six degrees of extra heat by 2100, wreaking havoc on living things worldwide.
But many are now challenging that claim.
“The temperature records cannot be relied on as indicators of global change,” John Christy, professor of atmospheric science at the University of Alabama, Huntsville, a former lead author for the IPCC, told The Sunday Times of London.
He and others say weather stations that have been used to amass temperature data over the past 150 years may not be accurate. The stations have been affected by urbanization, changes in land use and in many instances moves to different locations.
Christy’s research examines the impact of those factors on three different regions: east Africa, California and Alabama.
“The story is the same for each one,” he said. “The popular data sets show a lot of warming but the apparent temperature rise was actually caused by local factors affecting the weather stations, such as land development.”
Ross McKitrick, professor of economics at the University of Guelph, Canada, agrees.
“We concluded, with overwhelming statistical significance, that the IPCCs climate data are contaminated with surface effects from industrialization and data quality problems. These add up to a large warming bias,” he told The Sunday Times.
A new report by Joseph DAleo, a meteorologist who co-founded the Weather Channel, and veteran meteorologist Anthony Watts makes much the same points.
“Instrumental temperature data for the pre-satellite era (1850-1980) have been so widely, systemically and uni-directionally tampered with that it cannot be credibly asserted there has been any significant global warming in the 20th century,” they write.
“All terrestrial surface-temperature data bases exhibit very serious problems that render them useless for determining accurate long-term temperature trends.” Read more here.
--------------------------
IPCC Corruption Included Ignoring Facts and Science
By Dr. Tim Ball, Canada Free Press
Phil Jones, disgraced and dismissed Director of the Climatic Research Unit (CRU), granted BBC reporter Roger Harrabin an interview. Why Harrabin? His reporting has shown bias on all the IPCC and CRU activities. Leaked emails showed the CRU gang used friends in the BBC and that apparently continues. Prevarication, evasion, half-truths continue in Phil Jones’answers. Despite this there are stunning admissions from Jones. “There is a tendency in the IPCC reports to leave out inconvenient findings, especially in the part(s) most likely to be read by policy makers.”
It’s a deliberate strategy not just a tendency and not only in the Summary for Policymakers (SPM). Many major factors that create weather and can trigger change are ignored in the Scientific Report and computer models. Icecap Note: Tim then goes on in some detail to discuss one, the sun. He then concludes:
Watch the Richter Scale as Politicians Jump Off the IPCC Wagon
Jones only concedes some points but they are enough from the high priest of the CRU and IPCC to completely destroy its credibility. What will the sycophants and exploiters like Gore and the Mainstream Media do now? What about politicians who based positions and policy on environment and energy on the IPCC? What about the massive scams of Cap And Trade? What about the extreme environmental groups who have bullied and preached from the moral high ground? What about the scientists who took vehement positions without understanding? It is a very sad day for science, the people and the world. Read full post here.
-------------------------
Dalton Minimum Repeat goes mainstream
By David Archibald
The AGU Fall meeting has a session entitled “Aspects and consequences of an unusually deep and long solar minimum”. Two hours of video of this session can be accessed here.
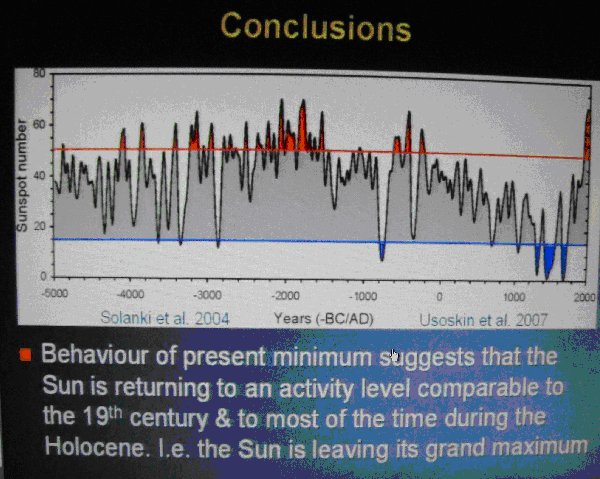
Two of the papers presented had interesting observations with implications for climate. First of all Solanki came to the conclusion that the Sun is leaving its fifty to sixty year long grand maximum of the second half of the 20th century. He had said previously that the Sun was more active in the second half of the 20th century than in the previous 8,000 years. This is his last slide:

Enlarged here.
To get his papers published, Solanki has had genuflect to global warming. Perhaps he won’t have to do that from now on.
McCracken gave a paper with its title as per this slide:
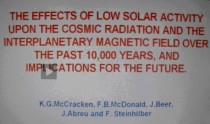
Enlarged here.
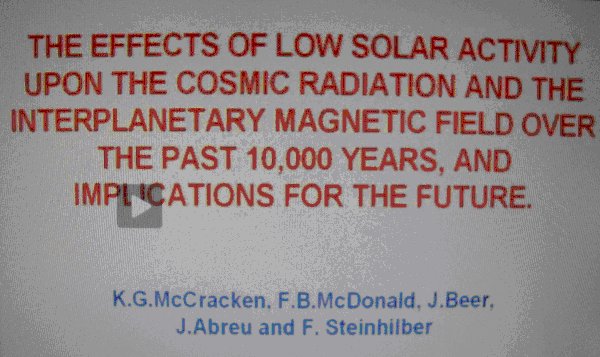
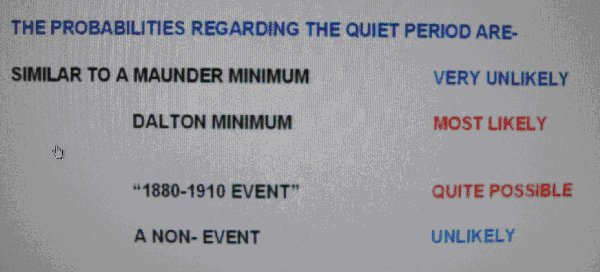
While he states that it is his opinion alone and not necessarily held by his co-authors, he comes to the conclusion that a repeat of the Dalton Minimum is the most likely thing to happen next:

Dalton Minimum Repeat goes mainstream. Enlarged here.
Solar Cycle 24 is now just over a year old and the next event on the solar calendar is the year of maximum, which the green corona brightness tells us will be in 2015.
A repeat of the Dalton Minimum will have consequences for the Earth’s climate. Just how cold will it have to get for the Thames to freeze over, as it last did in 1815? See PDF here.
----------------------
Stimulating Green Jobs For China
Investor’s Business Daily
When even Chuck Schumer is upset with the White House, you know something’s amiss. In this case, it’s news that efforts to boost wind power with taxpayer stimulus dollars are filling foreign coffers and creating foreign jobs.
According to the Investigative Reporting Workshop at American University, nearly $2 billion in money from the American Recovery and Investment Act has been spent on wind power. The goal was to further energy independence while creating American jobs. It has done neither.
Of the money spent, according to the report, nearly 80% has gone to foreign manufacturers of wind turbines.
“In all due respect, I remind (Energy Secretary Steven Chu) there is a four-letter word associated with the stimulus - J-O-B-S,” Sen. Schumer, D-N.Y., told ABC News, which interviewed him for a report done in coordination with the workshop’s investigation. “Very few jobs here, lots of jobs in China.”
The only good thing one can say is that at least China is a real place, as opposed to the phantom ZIP codes and congressional districts in which the administration has claimed to have created jobs.
But how does buying wind turbines made in China create energy independence or create jobs?
Last October, on the day the workshop first reported on this story, a consortium of U.S. and Chinese companies announced a deal to build a $1.5 billion wind farm in Texas, using imported Chinese turbines.
The project is expected to create some temporary construction jobs in America. Some 2,000 manufacturing jobs will be created in China. In a message posted on his Facebook page, Secretary Chu wrote that the point of the grant program was “ensuring America leads the world in creating jobs in manufacturing the parts that go into wind farms” and even export components to foreign wind farms. It hasn’t worked out that way.
Of the 1,807 turbines erected on 28 wind farms receiving grants, foreign-owned manufacturers built 1,219, according to the workshop report. The installation of these turbines may have created as many as 6,838 manufacturing jobs overseas.
When the American Wind Energy Association released its 2009 year-end report on Jan. 26, CEO Denise Bode acknowledged that despite billions in stimulus spending, there had actually been a net loss in manufacturing jobs. Bode told USA Today she estimates the manufacturing job loss at 1,500.
Last March, a cargo of steel towers was unloaded at the port of Vancouver, Wash. They were made in Vietnam for a Danish wind company and destined for a Portuguese wind farm in Indiana that got a stimulus grant. Posted 02/11/2010 05:50 PM ET
The towers arrived in Washington state after traveling 7,400 miles from Vietnam’s Barra VANUATU province, where they were constructed by CS Wind - Vietnam’s leading steel tower manufacturer.
We’re all for free trade, but stimulus money was supposed to create jobs in America. As for helping us achieve energy independence, wind has failed miserably.
After decades of subsidies, wind provides only 1% of our electricity compared with 49% for coal, 22% for natural gas, 19% for nuclear power and 7% for hydroelectric. Wind turbines generally operate at only 20% efficiency vs. 85% for coal, gas and nuclear plants.
The irony is we leave vast reserves of job-creating domestic oil, coal and natural gas locked up as we sacrifice our economy to the Gaia, the goddess of climate change, something China has wisely refused to do. Read story here.
Speaking of China:
Frozen Cattle Crisis In Harsh Mongolia Winter
Sky News
Up to 20 million farm animals may die in Mongolia before spring as the fiercest winter in living memory grips the country, International Aid Agencies are being warned. Half the entire country’s livestock could be wiped out, local experts told the Red Cross.
A Sky News team that travelled through remote regions in Central Mongolia found cattle, goats and sheep frozen to death across the plains, with some herds almost completely wiped out. Outside her traditional home in Central Mongolia, grandmother Hotont Suon weeps as she looks at the carcasses of her herd lying on their backs.

Their legs in the air, they are frozen to death. In the pens, sheep huddle together from the bitter cold. Two died while we watched. Dogs and goats gnaw from the carcasses of the dead animals strewn outside the traditional “gurs”, the herders’ circular tented homesteads.
“Our hay is all gone now. As our goats die we sell the hides and buy more fodder, but it only lasts a few days,” she said. It’s called the “Dzud” - a multiple disaster with a summer drought followed by one of the coldest winters on record. It has left millions of livestock dying from a combination of exhaustion and starvation - some herders report that their cattle perish at the rate of 50 a night.
Some families have even been reduced to sharing their small tented home with the surviving animals. Inside a gur, a three-month-old baby played with a black wet-faced calf. The baby’s mother, Otgon Jargal, broke down in tears. “We have no skills. Our lives depend on our livestock. How can I look after my child when all the animals have died?” she cried.
The Mongolian government has appealed for food, medicine and animal food to combat one of the country’s worst natural disasters. The poorer herding families are left with insufficient food supplies to last out the winter. Many have taken out high interest loans to pay for animal fodder which they can’t meet.
Fears are also growing for thousands of herders who live in remote mountain regions in soutwestern Mongolia. There has been no word from thousands of people cut off in their villages by the heaviest snow fall in decades, prompting Mongolian air force helicopters to launch search and rescue operations.
Read more here. See this shocking video here.
By Joseph D’Aleo
Update: Guest post by Steven Goddard on Watts Up with That
A 2005 Columbia University study titled “WILL CLIMATE CHANGE AFFECT SNOW COVER OVER NORTH AMERICA?” ran nine climate models used by the IPCC, and all nine predicted that North American winter snow cover would decline significantly, starting in about 1990.

See full post here.
UPDATE: Pittsburgh now has the snowiest February on record (since 1884) with 38.5 inches and the second snowiest month ever (behind the 40.2 in January 1978. In much of Montana, snowcover has been deep and longer lasting than any year in up to a quarter century.
A significant storm has brought heavy snows to Texas through the Gulf States to the southeast coast to Charleston, SC and even the FL Panhandle. Reports are that there was some snowcover in all 50 states for the first time ever recorded (or at least since the great cold outbreak of 1898/99). In actual fact, Hawaii, which normally has snow on its high volcanic peaks and did a few weeks ago, doesn’t at the moment although I would guess if you searched hard enough in the crevasses on the north facing slopes you might find some but even 49 states is quite a rare feat. The Joe Romm memorial winter continues to amaze.
The amazing snowcover map for February 13, 2010 enlarged here.
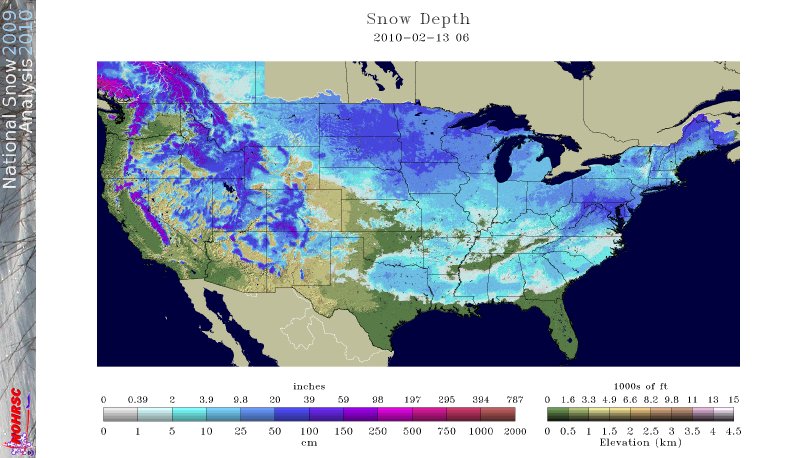
NATIONAL WEATHER SERVICE FORT WORTH TX
410 AM CST FRI FEB 12 2010
...Snow Event One For The Record Books…
As of Midnight CST, DFW Airport had recorded 11.2 inches for the calendar day. This is the greatest calendar-day snowfall total on record for Dallas/Fort Worth. The previous record was 7.8 Inches on January 15, 1964 and January 14, 1917.
As of 4 AM...DFW Airport had recorded 12.5 Inches of snow in the prior 24 hours. This breaks the previous 24-Hour record for February...7.5 Inches On February 17, 1978 and February 25, 1924.
This brings the seasonal snowfall total To 15.7 Inches...which is the 2nd highest seasonal total on record for Dallas/Fort Worth behind just 1977-78. This is the snowiest winter in 32 seasons (since 1977-1978).
DALLAS/FORT WORTH - SNOWIEST SEASONS
1 17.6 1977-78
2 15.7 2009-10*
3 15.3 1963-64
4 13.5 1923-24
5 10.4 1976-77
6 9.5 1909-10
7 9.2 1916-17
8 8.8 1947-48
9 8.1 1937-38
10 7.3 1965-66 and 1941-42
As the storm moved east, 8 inches fell in parts of MS not far from Jackson, 7 inches fell at Cooks Crossroads in AL, 4 inches of snow fell in Atlanta, GA with up to 6 to the southeast, 4 inches fell at Athens, GA and even 2 in Macon, GA and 3 inches fell in Charleston, SC with up to 7 inland. 1 inch fell at Jay in the northwest FL Panhandle. In all, 1180 snow records were set.
See Snow Line is Moving SOuth by Steve Goddard on Watts Up With That here.
-----------------------
Watch here as Bill Nye the Science Guy says that these storms are consistent with global warming and its just us older folks that can’t grasp the idea that billions more people are inducing climate change while younger people (brainwashed by their schools) seem to grasp it better.
See “A Psychological Profiling of Global Warming” in Clamour of the Times where Philip Stott explain why some people can’t let go of global warming here.
-------------------------
Climate panel facing calls to restructure
By Eloise Gibson, NZ Herald
Breaking News: Scroll down to ICING THE HYPE to see how one member of the CRU investigative panel has resigned
Leading climate scientists from three countries have called for radical changes to the United Nations’ climate change panel as it faces intense scrutiny.
NZ experts say the Intergovernmental Panel on Climate Change (IPCC) should simply follow its own rules to avoid slips such as the 2007 error exaggerating the speed of glacier melt in the Himalayas.
But four of five climatologists who were asked to propose solutions in the international journal Nature suggested more radical options. The Nature article, released yesterday, asked: “IPCC: cherish it, tweak it or scrap it?”.
Mike Hulme, an IPCC lead author of the University of East Anglia in England, said the panel should be split after its 2014 report to part the physical scientists who observe and predict climate change from a separate policy analysis group. A third group would carry out regional assessments.
He wanted six-yearly assessments covering all aspects of climate change scrapped in favour of policy reports on options such as carbon border tariffs and ways to slow deforestation.
A separate group of physical scientists would write “smaller, sharply focused” updates on the science. Jeff Price, a lead author on the third and fourth IPCC reports, said the process was too slow: “A new class of short, rapidly prepared, peer-reviewed reports is needed.”
And Eduardo Zorita of the GKSS Research Centre in Germany said the IPCC should be replaced by an “International Climate Agency”, perhaps with 200 staff. He said the International Atomic Energy Agency, the European Central Bank or the US Congressional Budget Office showed it was possible to be independent and respected.
John Christy of the University of Alabama suggested turning the IPCC into “a living, Wikipedia-IPCC” open to published scientists, to be updated online and with sections overseen by groups of four to eight experts.

Several experts said a problem was that the IPCC produces its main reports only once every six years. The last was in 2007 drawing on the work of 2500 experts and totalling about 3000 pages.
But Thomas Stocker of the University of Bern, a co-chair of one of the IPCC's three main working groups, defended the panel's existing plans, saying reports every six years ensured "the robustness required for a thorough assessment".
He said the panel had fulfilled its role as an "honest broker" with "remarkable rigour and integrity".
New Zealand climate scientists agreed, saying that rather than "fixing" the panel its facilitators should be asking why the Himalayan glacier paper made its way into a report and how it was not picked up.
"It is ... clear that this mistake could have been avoided," said Victoria University climate researcher Andy Reisinger, "if all people involved in the process ... had meticulously followed the existing guidelines.
"Asking for wholesale revision to the IPCC in the wake of this mistake appears to be throwing out the baby with the bathwater, and dismantling the bath tub as well, when all it needed was a reminder to clean behind the ears."
An error that Himalayan glaciers could melt by 2035 - a huge exaggeration of the thaw - led to calls for reforms of the panel that shared the 2007 Nobel Peace Prize.

Read more here.
UPDATE: See Kirk Myers Seminole County Exnvironmental News Examiner column here on snowstorms and global warming.
By Joseph D’Aleo
MEDIA SPIN ZONE
Time Magazine tells us record Mid-Atlantic snows are consistent with or even resulting from global warming. The equally grumpy and empty headed reporters at MSNBC agreed.
The last few years, they ignored the snow that set all-time records further north in much of western and southern Canada, Washington, Oregon, Colorado, Iowa, North Dakota, Wisconsin, Michigan, Vermont, New Hampshire and Maine and overseas in Europe, south China, Middle East, South America and New Zealand. But when it falls in the normally bare ground Mid-Atlantic and especially in the capitol where the politicians, environmental NGO and alternative energy lobby calls home, it can no longer be ignored (see story here). Especially on a day when NOAA had planned a press release on their new Climate Service, formed to help us deal with a warming world, which instead was done via a phone teleconference.
So to try and save their agenda, the green media and alarmists spin the tale that these storms are what you expect during global warming. Actually friends they conflict with statements from the IPCC and EPA Technical Support Document that drew on the NOAA CCSP.
EPA TSD ES3 “Rising temperatures have generally resulted in rain rather than snow in locations and seasons where climatological average (1961-1990) temperatures were close to 0C. (32F).”
IPCC FAQ 3.2 Observations show that changes are occurring in the amount, intensity, frequency and type of precipitation. More precipitation now falls as rain rather than snow in northern regions. For a future warmer climate, models project a 50 to 100% decline in the frequency of cold air outbreaks relative to the present in NH winters in most areas.
“The 2009 U.S. Climate Impacts Report found that large-scale cold-weather storm systems have gradually tracked to the north in the U.S. over the past 50 years.”
A DOSE OF REALITY
Preliminary all-time seasonal snowfall records were set at the three major climate sites in the Baltimore-Washington area...The Washington- Baltimore January average temperatures are near freezing (BWI 32.3F, DCA 34.9F, IAD 31.7F) with at lreast a month of winter to go.
In February in Dulles, the coldest spot, it averages 34.8. They are running 6.8F below normal so far not warmer. Dulles month-to-date has had 38.6 inches not including today. IAD was 0.8F below normal in December when the first snow came (35.2F vs. 36F average).
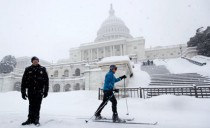
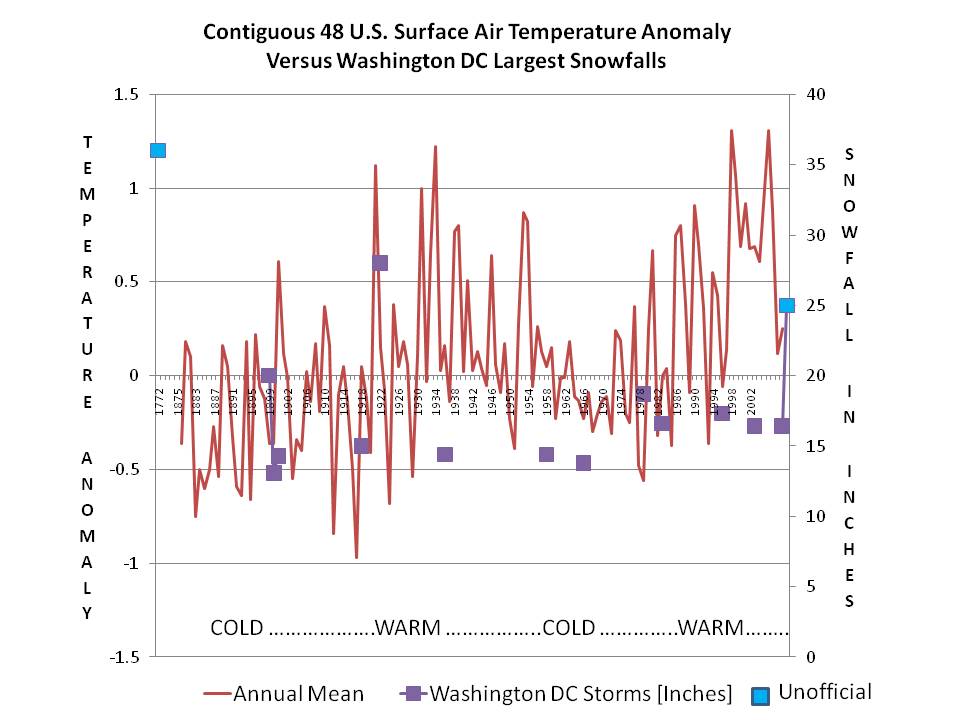
With the 10.8 inch two-day snowfall total measured at Ronald Reagan Washington National airport...the seasonal snowfall total in Washington DC stands at 55.9 inches. This would break the previous all-time seasonal snowfall record of 54.4 inches set in the winter of 1898-99. Official snowfall records for Washington DC date back 126 years to 1884. See chart of snow versus annual temperatures courtesy of Bruce Hall below described here and enlarged here.
With the 19.5 inch two-day snowfall total measured at Baltimore/Washington International Thurgood Marshall airport...the seasonal snowfall total in Baltimore stands at 79.9 inches. This would break the previous all-time seasonal snowfall record for Baltimore of 62.5 inches set in the winter of 1995-96. Official snowfall records for Baltimore date back 118 years to 1893.
Finally, the two-day snowfall total at Dulles is 9.3 inches...which would make this years seasonal snowfall total 75.0 inches.. This would break the previous seasonal snowfall record of 61.9 inches set in 1995-96. Official snowfall records for Dulles date back 48 years to 1962.
In Philadelphia, 71.6 inches has fallen this year breaking the seasonal record of 65.5 inches. Atlantic City, NJ has had 49.9 breaking the record of 46.9 inches set in 1966-1967.
Though MUCH less snowy this year (note NYC Central Park has seen 25.5 inches and Boston’s Logan Airport 30.1 inches as of February 11), recent years have seen big time snows in cities further north even though like DC their temperatures are not far from the 32F level in their climatology.
New York City’s Central Park has a January (their coldest month) average temperature of 0.1C and winter average of 1.0C. For the first time since records began in the 1860s, Central Park reported four successive years of 40 inches of snow or more ending in the winter of 2005/06. On February 11-12, 2006, Central Park broke the all-time single snowstorm record with 26.9 inches of snow. Also in 1995/96, Central Park and most other cities in the central and eastern US had all-time record seasonal snowfall. In Central Park, that winter brought 76 inches of snow.
Boston, MA where the winter temperature averages -0.1C, the 12 year average snowfall in the winter ending 2004/05 was 51.3 inches, the highest in their entire record dating back into the 1800s. A new all-time single snowstorm record was set on February 17-18, 2003 with 27.6 inches and a new all-time seasonal snowfall record of 108 inches was set in 1995/96. Since 1992, Boston has recorded their 1st, 3rd, 5th, 7th and 12th snowiest winters.
Enlarged here.
We are also told “The extent of NH snow cover has declined”. (IPCC4.2) They go on to say it will decline so much as to endanger the winter sports industry. Well two years ago, Michael Berry, President of the National Ski Areas Association told the AP that “This could very well be the record year”. Across almost all of North America, 2007/08 was the best, or one of the best seasons ever for those who enjoy winter sports. Practically every ski area from Alaska across Canada in the Western U.S. - the Midwest and New England saw plenty of snow; many places reporting all-time record snow.
And January in 2008, a new record for snowcover was set for the hemisphere.
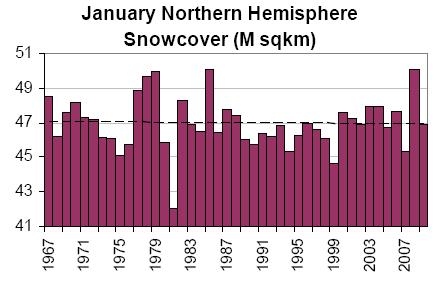

February is likely to set a new record or be among the top snowiest Februarys in the hemisphere. We were in 4th place in 5th week of the year (in 31 years) (below enlarged here).
This is reminiscent of the day in January 2000, when NOAA’s NWS had a press conference to state that they had just made operational a super-computer that should ensure they never again would miss another major storm. The very next day a major noreaster dumped heavy snow on all the eastern cities not forecast by their super computer and their models just 24 hour ahead. This heralded the Gore effect which is spreading.
By the way while the deal with mail box hiding snow in DC, Northern New England west to Michigan is seeing much below normal snows though it is cold. This is typical in El Ninos but the real driver for locking in the storm track so far south was the 5 standard deviation negative AO in December and again this month. This forces cold air to middle latitudes feeding cold air into the southern storm track especially as El Nino weakens.
BUT ALARMISTS HOLLER “WE PROMISED GLOBAL WARMING WOULD BRING STRONGER STORMS”
The 2009 U.S. Climate Impacts Report found that large-scale cold-weather storm systems have gradually tracked to the north in the U.S. over the past 50 years. This year we have had snow as far south as Miami and Naples Florida with snow possible Friday and again next week in the Gulf States down to the Florida panhandle. More Florida freezes are likely through early last week, where the January cold set records for duration and did serious damage to the citrus (worst freeze damage since 1989).
They also stated the warming would be greatest in higher latitudes. Actually that would decrease the contrast in temperatures north to south, which is what feeds the mid-latitude storms. They should grow weaker not stronger and with warming and the jet stream retreating north not south, global warming would not suggest snow to the Gulf of Mexico.
Cooling is what produces clouds and precipitation. The earth is cooling, the folks in the Mid-Atlantic and southeast will attest to that. No media spin to the contrary or data manipulation by NOAA, NASA can convince them otherwise. Read more here.
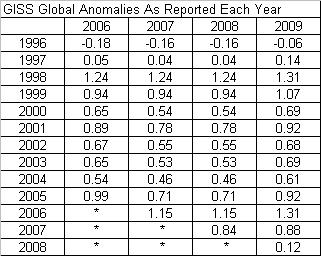
This letter was sent to NASA GISS’s James Hansen by Arvind Kumar after he noticed that the anomalies he had downloaded each year had changed with each new update.
Dear Dr. Hansen,
I see that the numbers in the data set here keep changing. I know that there were reports that you revised them once to make 1934 the hottest year on record and this was due to a bug. However, when I go to archive.org, I find that the numbers for specific years change arbitrarily and I have picked dates after you made the change. Perhaps it is not arbitrary, and maybe this is the famous “Mike’s Nature Trick” that everyone speaks of? Can you please explain why the numbers for the same year keeps changing?
Here are links and the data sets for 01/10/2006, 10/14/2007, 02/21/2008 and current date.
The numbers for the Annual Mean from the four links for many of the years are not constant but are as follows (enlarged here):
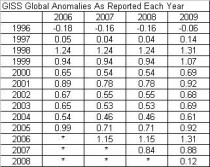
It is disturbing because it appears that the numbers are touched every year so that the claim of the current year being the “hottest on record” or the “second hottest on record” can be made. This would be consistent with, for example, 2005 when the number was first .99 but needed to be wound down to .71 the next year when the numbers for 2006 came out so that the 2006 number was significantly higher than the number for 2005. Subsequently, the 2005 number had to be increased in order to make the average for the decade higher.
Thanks,
Arvind
Arvind then documented the year to year changes here.
Well the answer came from E. M. Smith of the Musings from the Chiefio site:
“It is inherent to the way GIStemp runs that every month will produce a new and different history.
EACH and EVERY time the input data changes (by, for example, having a new month of data as time passes) will produce a different set of ‘homogenization’ adjustments and different UHI adjustments and GRID Box adjustments.
One example: All records shorter than 20 years are disposed. If a record is 19 years 11 months long, it is simply thrown away. In the next month, ti will be 20 years old, and so kept. Suddenly there are 20 years of history for this new record and just as suddenly it will be used to fill in missing data in other temperature series for the past 20 years. More perniciously, it will also participate in UHI adjustments that may extend to the beginning of time in the data set (it can help determine the adjustment factor during the period of overlap, that may then be applied in far removed times.)
So it is simply to be expected that history, in GIStemp, is a polite fiction that is re-written on each monthly computer run. So you can point this out to Hansen and friends and they will simply nod approvingly.”
By David Freddoso, Online Opinion Editor, Washington Examiner
Robert F. Kennedy Jr., who flies around on private planes so as to tell larger numbers of people how they must live their lives in order to save the planet, wrote a column last year on the lack of winter weather in Washington, D.C.
In Virginia, the weather also has changed dramatically. Recently arrived residents in the northern suburbs, accustomed to today’s anemic winters, might find it astonishing to learn that there were once ski runs on Ballantrae Hill in McLean, with a rope tow and local ski club. Snow is so scarce today that most Virginia children probably don’t own a sled. But neighbors came to our home at Hickory Hill nearly every winter weekend to ride saucers and Flexible Flyers.
In those days, I recall my uncle, President Kennedy, standing erect as he rode a toboggan in his top coat, never faltering until he slid into the boxwood at the bottom of the hill. Once, my father, Atty. Gen. Robert Kennedy, brought a delegation of visiting Eskimos home from the Justice Department for lunch at our house. They spent the afternoon building a great igloo in the deep snow in our backyard. My brothers and sisters played in the structure for several weeks before it began to melt. On weekend afternoons, we commonly joined hundreds of Georgetown residents for ice skating on Washington’s C&O Canal, which these days rarely freezes enough to safely skate.
Meanwhile, Exxon Mobil and its carbon cronies continue to pour money into think tanks whose purpose is to deceive the American public into believing that global warming is a fantasy.
Having shoveled my walk five times in the midst of this past weekend’s extreme cold and blizzard, I think perhaps RFK, Jr. should leave weather analysis to the meteorologists instead of trying to attribute every global phenomenon to anthropogenic climate change.
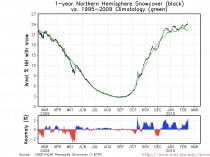
By Shanta Barley, New Scientist
A rise in water vapour in the atmosphere fuelled 30 per cent of the global warming that took place during the 1990s. This discovery suggests that the potent greenhouse gas plays a bigger role in climate change that we previously imagined.
Susan Solomon and colleagues at the US National Oceanic and Atmospheric Administration combined satellite measurements and weather balloon data to track changes in the concentration of water vapour 16 kilometres up in the stratosphere, between the 1980s and today.
Water vapour levels in the stratosphere increased in the 1990s but dropped by 10 per cent in 2001. After feeding their measurements into a climate model, the team suggests that vapour was to blame for almost a third of the warming that happened in the 1990s.
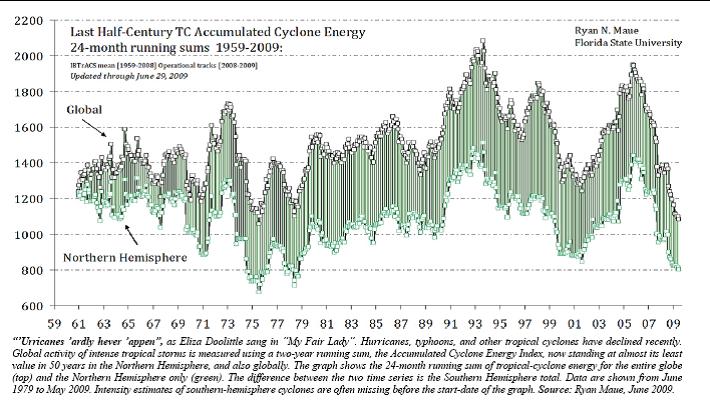
Icecap Note: that corresponded to a decline in tropical activity during the cold PDO La Ninas of 1999 to 2001 (below, enlarged here).
It likely bounced back and then declined agin afte the 2005 tropical activity spike
The model also suggests that the decline in water vapour concentrations that occurred in 2001 slowed down the rate of global warming in the last decade by 25 per cent.
“This research does not change the consensus view that human emissions drive climate change,” says Fortunat Joos, a climate modeller at the University of Bern, Germany.
Journal reference: Science DOI: 10.1126/science.1182488
Water vapor is 20 times more abundant greenhouse gas than CO2, a bit player at best in climate change, but of course you can’t tax or control the hydrological cycle
-------------------------
Is the NULL default infinite hot?
By E.M. Smith
What to make of THIS bizarre anomaly map?
What Have I Done?
I was exploring another example of The Bolivia Effect where an empty area became quite “hot” when the data were missing (Panama, posting soon) and that led to another couple of changed baselines that led to more ‘interesting red’ (1980 vs 1951-1980 baseline). I’m doing these examinations with a 250 km ‘spread’ as that tells me more about where the thermometers are located. The above graph, if done instead with a 1200 km spread or smoothing, has the white spread out to sea 1200 km with smaller infinite red blobs in the middles of the oceans.
I thought it would be ‘interesting’ to step through parts of the baseline bit by bit to find out where it was “hot” and “cold”. (Thinking of breaking it into decades… still to be tried...) When I thought:
Well, you always need a baseline benchmark, even if you are ‘benchmarking the baseline’, so why not start with the “NULL” case of baseline equal to report period? It ought to be a simple all white land area with grey oceans for missing data.
Well, I was “A bit surprised” when I got a blood red ocean everywhere on the planet.
You can try it yourself at the NASA / GISS web site map making page.
In all fairness, the land does stay white (no anomaly against itself) and that’s a very good thing. But that Ocean!
ALL the ocean area with no data goes blood red and the scale shows it to be up to 9999 degrees C of anomaly.
“Houston, I think you have a problem”.
Why Don’t I Look In The Code?
Well, the code NASA GISS publishes and says is what they run, is not this code that they are running.
Yes, they are not publishing the real code. In the real code running on the GISS web page to make these anomaly maps, you can change the baseline and you can change the “spread” of each cell. (Thus the web page that lets you make these “what if” anomaly maps). In the code they publish, the “reach” of that spread is hard coded at 1200 km and the baseline period is hard coded at 1951-1980.
So I simply can not do any debugging on this issue, because the code that produces these maps is not available.
But what I can say is pretty simple:
If a map with no areas of unusual warmth (by definition with the baseline = report period) has this happen; something is wrong.
I’d further speculate that that something could easily be what causes The Bolivia Effect where areas that are lacking in current data get rosy red blobs. Just done on a spectacular scale.
Further, I’d speculate that this might go a long way toward explaining the perpetual bright red in the Arctic (where there are no thermometers so no thermometer data). This “anomaly map” includes the HadCRUT SST anomaly map for ocean temperatures. The striking thing about this one is that those two bands of red at each pole sure look a lot like the ‘persistent polar warming’ we’ve been told to be so worried about. One can only wonder if there is some “bleed through” of these hypothetical warm spots when the ‘null data’ cells are averaged in with the ‘real data cells’ when making non-edge case maps. But without the code, it can only be a wonder:
With 250 km ‘spread’ and HadCRUT SST anomalies we get bright red poles.
The default 1200 km present date map for comparison:
GIS Anomaly Map for November 2009
I’m surprised nobody ever tried this particular ‘limit case’ before. Then again, experienced software developers know to test the ‘limit cases’ even if they do seem bizarre, since that’s where the most bugs live. And this sure looks like a bug to me.
A very hot bug… Read more here.
Read also the Madagascar Muse here which shows despite no stations, a permanent red spot appeared over Madagascar in recent years thanks to the interpolation made. In the latest update after the post, GISS removed that hotspot.
See Surface temperature Records: Policy Driven Deception? which heavily drew on data from E.M. Smith and postings by Anthony Watts here.
----------------------
UAH MSU jumped this month with a boost from ocean temperature rises. This has been jumped on by alarmsists trying to deflect attention from the brutal Northern Hemisphere land winter. Why the satellite sensed ocean warming? Walter Starck explains:
“Sea surface temperatures in the top meter of the oceans rapidly increase in periods of extended calm weather due to the cessation of wave driven mixing. After a week or two of calm, the surface temperature may become as much as 4-5 degrees higher than the temperature 2m below the surface. This thermal stratification disappears in a few hours when normal trade winds resume. El Niño events are characterized by extended and expanded areas of calm over the tropical oceans and it is this calm, not exceptional atmospheric temperatures, which is responsible for the rise in sea surface temperatures.
Elevated sea surface temperatures would presumably result in greater transfer of thermal energy to the atmosphere via increased back radiation, conduction/convection and evaporation. After an El Nino, when the warm layer is again mixed through the normal 70-100m thickness of the surface zone above the thermocline, the total thermal content should be somewhat less than it otherwise would be due to the cessation of mixing during the period of calm and the greater loss to the atmosphere from the higher temperature shallow surface layer. The result is that the high SSTs characteristic of El Ninos is followed by a period of lower than average surface temperatures (i.e. La Nina). This seems quite evident following the 1998 El Nino.
I am aware of the high temperature shallow surface layer from a lifetime of diving in the tropics where I have experienced it directly on repeated occasions. Although this warm surface layer would show up in old fashioned measurements taken using buckets it would not appear in temperatures taken from cooling water intakes on ships since they are below it and XBT records would be problematic as the heated layer is so limited in thickness.
I suspect that the high January SSTs just experienced are a manifestation of this effect and will be followed by lower than average SSTs when normal trade winds resume. The important thing that is not being properly recognized is that the higher SSTs of El Nino events involves only a very shallow surface layer, not the entire upper mixed layer of the ocean.”
By Richard North
Less than a week after he claimed the IPCC’s credibility had increased as a result of its handling of the “Glaciergate” scandal, Pachauri’s own personal credibility lies in tatters as The Times accuses him of a direct lie.
This is about when he first became aware of the false claim over the melting glaciers, Pachauri’s version on 22 January being that he had only known about it “for a few days” - i.e., after it had appeared in The Sunday Times.
However, Ben Webster writes that a prominent science journalist, Pallava Bagla - who works for the Science journal (and NDTV as its science correspondent) - claims that last November he had informed Pachauri that Graham Cogley, a professor at Ontario Trent University and a leading glaciologist, had dismissed the 2035 date as being wrong by at least 300 years. Pachauri had replied: “I don’t have anything to add on glaciers.”
Bagla interviewed Dr Pachauri again this week and asked him why he had decided to overlook the error before the Copenhagen summit. In the taped interview, he asked: “I pointed it out [the error] to you in several e-mails, several discussions, yet you decided to overlook it. Was that so that you did not want to destabilise what was happening in Copenhagen?”
Dr Pachauri replied: “Not at all, not at all. As it happens, we were all terribly preoccupied with a lot of events. We were working round the clock with several things that had to be done in Copenhagen. It was only when the story broke, I think in December, we decided to, well, early this month - as a matter of fact, I can give you the exact dates - early in January that we decided to go into it and we moved very fast.”
According to Pachauri, “… within three or four days, we were able to come up with a clear and a very honest and objective assessment of what had happened. So I think this presumption on your part or on the part of any others is totally wrong. We are certainly never - and I can say this categorically - ever going to do anything other than what is truthful and what upholds the veracity of science.”
Without even Bagla’s input, we know this to be lies. Apart from anything else, there was the crisis meeting under the aegis of UNEP - which we reported on Thursday - which concluded that the 2035 claim “does not appear to be based upon any scientific studies and therefore has no foundation”.
Separately, we have Syed Hasnain, while stressing that he was not involved in drafting the IPCC report, claiming that he noticed some of the mistakes when he first read the relevant section in 2008.
That was also the year he joined TERI in Delhi, headed by Dr Pachauri. Then, he says, he realised that the 2035 prediction was based on an interview he gave to the New Scientist magazine in 1999. But, he claims, he did not tell Pachauri because he was not working for the IPCC and was busy with his own programmes.
“I was keeping quiet as I was working here,” he said. “My job is not to point out mistakes. And you know the might of the IPCC. What about all the other glaciologists around the world who did not speak out?”
However, Hasnain’s assertions contrast rather sharply with a video interview given by him to NDTV (see clip above) on 9 November 2009 - the day that the Raina report on glaciers was published, challenging the claims made in the IPCC report. Then, he is seen to be defending the 2035 figure, and allowing himself to be styled as “author of the original IPCC report”.
According to The Guardian, V K Raina, formerly deputy director general of the Geological Survey of India, has joined calls for Pachauri’s resignation.
The Guardian cites India’s Economic Times from over a week ago, which criticised the IPCC for damaging its own credibility, noting that “it would now seem that Mr Pachauri’s steadfast unwillingness to consider an alternate position could well have given climate sceptics a stronger footing.”
But today, the Deccan Herald also weighs in, declaring: “The [glacier] incident reflects poorly on the professionalism and scientific rigour of the IPCC and has done damage to its credibility.” The writing is not so much on the wall as obliterating it.
Adding to the graffiti, in yet another development, the popular Indian magazine Open rips apart global warming, labelling it: “The Hottest Hoax in the World.” Indian blogger Gurmeet in Liberty News Central thinks this could be the most hard-hitting article in the Indian MSM on AGW fraud ever.
Given what is about to descend upon him on Sunday, by the time the Indian media have absorbed the detail, Pachauri will be history. See Richard North’s blog here.
-------------------------
Global Warming: the Collapse of a Grand Narrative
By Philip Stott, The Clamour of the Times, Saturday, 30 January 2010
For over a month now, since the farcical conclusion of the Copenhagen Climate Change Conference, I have been silent, partly through family commitments abroad in the USA, but also because, in this noisy world, in ‘The Clamour Of The Times’, it is on occasion better to be quiet and contemplative, to observe rather than to comment. And, as an independent academic, it has been fascinating to witness the classical collapse of a Grand Narrative, in which social and philosophical theories are being played out before our gaze. It is like watching the Berlin Wall [pictured] being torn down, concrete slab by concrete slab, brick by brick, with cracks appearing and widening daily on every face - political, economic, and scientific. Likewise, the bloggers have been swift to cover the crumbling edifice with colourful graffiti, sometimes bitter, at others caustic and witty.

The Political And Economic Collapse
Moreover, the collapse has been quicker than any might have predicted. The humiliating exclusion of Britain and the EU at the end of the Copenhagen debacle was partially to be expected, but it was brutal in its final execution. The swing of power to the BASIC group of countries (Brazil, South Africa, India, China) had likewise been signified for some time, but, again, it came with precipitate ease, leaving even the American President, Barack Obama, with no doubts as to where the political agenda on climate change was now heading, namely to the developing world, but especially to the East, and to the Pacific Rim. The dirigiste tropes of ‘Old Europe’, with its love of meaningless targets and carbon capping, will no longer carry weight, while Obama himself has been straitjacketed by the voters of Massachusetts, by the rust-belt Democrats, by a truculent Congress, by an increasingly-sceptical and disillusioned American public, but, above all, by the financial crisis. Nothing will now be effected that for a single moment curbs economic development, from China to Connecticut, from Africa to Alaska.
And, as ever, capitalism has read the runes, with carbon-trading posts quietly being shed, ‘Green’ jobs sidelined, and even big insurance companies starting to hedge their own bets against the future of the Global Warming Grand Narrative. These rats are leaving the sinking ship far faster than any politician, many of whom are going to be abandoned, left, still clinging to the masts, as the Good Ship ‘Global Warming’ founders on titanic icebergs in the raging oceans of doubt and delusion.
The Scientific Collapse
And what can one say about ‘the science’? ‘The ‘science’ is already paying dearly for its abuse of freedom of information, for unacceptable cronyism, for unwonted arrogance, and for the disgraceful misuse of data at every level, from temperature measurements to glaciers to the Amazon rain forest. What is worse, the usurping of the scientific method, and of justified scientific scepticism, by political policies and political propaganda could well damage science sensu lato - never mind just climate science - in the public eye for decades. The appalling pre-Copenhagen attacks by the British Prime Minister, Gordon Brown, and his climate-change henchman, Ed Miliband, on those who dared to be critical of the science of climate change were some of the most unforgivable I can recall.
It is further salutary that much of the trouble is now emanating from India. Indeed, the nonsense written about the Indian Sub-Continent has been a particular nadir in climate-change science, and it has long been judged so by many experts on the region. My ex-SOAS friend and colleague, Dr. Robert Bradnock, a world authority on the Sub-Continent, has been seething for years over the traducing of data and information relating to this key part of the world. In June, 2008, he wrote:
“However, in my own narrow area of research, I know that many of the claims about the impact of ‘global warming’ in Bangladesh, for example, are completely unfounded. There is no evidence that flooding has increased at all in recent years. Drought and excessive rainfall are the nature of the monsoon system. Agricultural production, far from being decimated by worsening floods over the last twenty years, has nearly doubled. In the early 1990s, Houghton published a map of the purported effects of sea-level rise on Bangladesh. Coming from a Fellow of the Royal Society, former Head of the Met Office and Chair of the IPCC, this was widely accepted, and frequently reproduced. Yet, it shows no understanding of the complex processes that form the Bengal delta, and it is seriously misleading. Moreover, despite the repeated claims of the World Wide Fund, Greenpeace, and, sadly, Christian Aid, the melting of the Himalayan glaciers is of completely marginal significance to the farmers of the plains in China, India, Bangladesh, and Pakistan. One could go on!”
The Media Collapse
One could indeed! But we may not need to do so for much longer. Why? Because the biggest collapse is in the media, the very ‘mechanism’ through which the greedy Global Warming Grand Narrative has promulgated itself during the last ten to twenty years. The break in the ‘Media Wall’ began in the tabloids and in the ‘red tops’, like The Daily Express and the Daily Mail and Mail on Sunday, but it is today spreading rapidly - yet once more as theory predicts - to the so-called ‘heavyweights’ and to the BBC. In the past, uncritical and apocalyptic stories and programmes were given the highest prominence, with any sceptical comment confined to the briefest of quotations from some benighted, and often snidely-mentioned, sceptic squeezed in at the very end of the piece ("For balance, you know"). Today, the reverse is becoming true, with the ‘global warming’ faithful firmly forced on to the back foot. Yet, in our post-modern world, it is the journalistic language being employed that is the true indicator of a new media order. Listening to good old Roger Harrabin this morning, reporting on BBC Radio 4’s flagship ‘Today’ programme, was a revelation in this respect; the language, and even the style, had altered radically.
Potential Losers
The collapse is now so precipitate that there will inevitably be some serious losers caught out by it all. The UK Met Office could well be one, with the BBC rightly reviewing its contract with them. At the moment, Met Office spokespersons sound extraordinary, bizarre even. They bleat out ‘global warming’ phrases like programmed robotic sheep, although they are finding it increasingly difficult to pull the wool over our eyes. It is terribly 1984, and rather chilling, so to speak. It is obvious that the organisation is suffering from another classical academic state, namely that known as ‘cognitive dissonance’ [see here and here]. This is experienced when belief in a Grand Narrative persists blindly, even when the facts in the real world begin to contradict what the narrative is saying. Sadly, many of our public and private organisations have allowed themselves to develop far too great a vested interest in ‘global warming’, as have too many politicians and activists. These are increasingly terrified, many having no idea how to react, or how to adjust, to the collapse. It will be particularly interesting to witness how, in the end, the Royal Society plays its cards, especially if competing scientific paradigms, such as the key role played by water vapour in climate change, start to displace the current paradigm in classic key role played by water vapour in climate change, start to displace the current paradigm in classic fashion. Icecap Note: This may be Susan Solomon’s bout with cognitive dissonance.
“For over a month now, since the farcical conclusion of the Copenhagen Climate Change Conference, I have been silent, partly through family commitments abroad in the USA, but also because, in this noisy world, in ‘The Clamour Of The Times’, it is on occasion better to be quiet and contemplative, to observe rather than to comment. And, as an independent academic, it has been fascinating to witness the classical collapse of a Grand Narrative, in which social and philosophical theories are being played out before our gaze. It is like watching the Berlin Wall [pictured] being torn down, concrete slab by concrete slab, brick by brick, with cracks appearing and widening daily on every face - political, economic, and scientific. Likewise, the bloggers have been swift to cover the crumbling edifice with colourful graffiti, sometimes bitter, at others caustic and witty.
Certain newspapers, like my own DNOC, The Times, have also been a tad slow to grasp the magnitude of the collapse (although Ben Webster has tried valiantly to counter this with some good pieces); yet, even such outlets at last appear to be fathoming the remarkable changes taking place. Today, for example, The Times carries a brief, but seminal, critique of the ‘science’ from Lord Leach of Fairford.
What Will It Mean?
I have long predicted, and in public too, that the Copenhagen Conference could prove to be the beginning of the end for the Global Warming Grand Narrative. It appears that I may well have been right, and, indeed, I may have considerably underestimated the speed, and the dramatic nature, of the demise. Where this all leaves our politicians and political parties in the UK; where it leaves climate science, scientists more generally, and the Royal Society; where it leaves energy policy; where it leaves the ‘Green’ movement; and, where it leaves our media will have to be topics for many later comments and analyses. For the moment, we must not underestimate the magnitude of the collapse. Academically, it is jaw-dropping to observe.
And, the political, economic, and scientific consequences will be profound. See Philip’s site sinfonia here.
See also Dr. Vincent Gray’s view of the Decline of Science here.
Recent revelations from the Climategate emails, originating from the Climatic Research Unit at the University of East Anglia showed how all the data centers, most notably NOAA and NASA, conspired in the manipulation of global temperature records to suggest that temperatures in the 20th century rose faster than, in reality, they actually did.
This has inspired climate researchers worldwide to take a hard look at the data proffered by comparing it to the original data and to other data sources. This report compiles some of the initial alarming findings.
There has clearly been some cyclical warming in recent decades, most notably 1979 to 1998. However, the global surface-station data is seriously compromised. First, there is a major station dropout and increase in missing data in stations that remained which occurred suddenly around 1990; about the time the global warming issue was being elevated to importance in political and environmental circles. A clear bias was found towards removing cooler higher elevation, higher latitude, and rural stations during this culling process though leaving their data in the base periods from which ‘averages’ and anomalies are computed.
The data also suffers contamination by urbanization and other local factors such as land-use/land-cover changes and improper siting. There are uncertainties in ocean temperatures; no small issue, as oceans cover 71% of the earth’s surface.
These factors all lead to significant uncertainty and a tendency for overestimation of century-scale temperature trends. A conclusion from all findings suggest that global data bases are seriously flawed and can no longer be trusted to assess climate trends or rankings or validate model forecasts. And, consequently, such surface data should be ignored for decision making.
This SPPI sponsored working paper by Joe D’Aleo of Icecap and Anthony Watts of Watts Up With That looks at the many issues associated with NOAA and NASA temperature data.
NOAA has already responded to the preliminary paper for John Coleman’s KUSI special through the Yale Climate Forum:
However, as Thomas Peterson and Russell Vose, the researchers who assembled much of GHCN, have explained:
“The reasons why the number of stations in GHCN drop off in recent years are because some of GHCN’s source datasets are retroactive data compilations (e.g., World Weather Records) and other data sources were created or exchanged years ago. Only three data sources are available in near-real time.
It’s common to think of temperature stations as modern Internet-linked operations that instantly report temperature readings to readily accessible databases, but that is not particularly accurate for stations outside of the United States and Western Europe. For many of the world’s stations, observations are still taken and recorded by hand, and assembling and digitizing records from thousands of stations worldwide is burdensome.
During that spike in station counts in the 1970s, those stations were not actively reporting to some central repository. Rather, those records were collected years and decades later through painstaking work by researchers. It is quite likely that, a decade or two from now, the number of stations available for the 1990s and 2000s will exceed the 6,000-station peak reached in the 1970s.”
So rest assured, we can make trillion dollar decisions today based on imperfect, tainted data and correct it in two decades when we painstakingly gather the missing data for the 1990s through 2010s and fix it. Our government at work.
See also SPPI’s December Monthly CO2 Report by Christopher Monckton here.
See this interesting analysis that shows why interpolating large distances to estimate temperatures is fraught with error here. See E.M. Smith’s “Temperatures now compared to maintained GHCN” where he responds to NCDC claims that gathering data is hard here.
-----------------------------------
NASA, NOAA create global warming trend with cooked data
By Kirk Myers, Seminole County Environmental Examiner
The cooks - er, “scientists” - at NASA’s Goddard Institute of Space Studies (GISS) have released their latest sky-is-falling temperature findings, and they show 2009 as the second-warmest year for the planet since modern record-keeping began in 1880, and 2009 temperatures in the Southern Hemisphere the warmest since 1880.
The head chefs at NOAA’s National Climatic Data Center (NCDC), working from a slightly different recipe, reveal a 2009 that was not as well done as NASAs, ranking only the fifth-warmest since 1880.
Other not-so-well-done findings:
NASA cooks:
January 2000 to December 2009 was the warmest decade on record. Surface temperatures have been trending upward 0.38 degrees per decade during the last three decades. In total, average global temperatures have increased by about 1.4 degrees since 1880 ("an important number to keep in mind,” says NASA climatologist Gavin Schmidt.)
NOAA chefs:
Global land and ocean annual surface temperatures for 2009 tied with 2006 as the fifth-warmest on record, at 1.01 degrees about the 20th century average. The 2000 - 2009 decade is the warmest on record, with average global surface temperature of 0.96 degrees above the 20th century average.
Land surface temperatures in 2009 tied with 2003 as the seventh-warmest on record, at 1.39 degrees above the 20th century average. The years 2001- 2008 each rank among the 10 warmest years since 1880.
How do they arrive at the numbers?
There is a major problem with the NASA and NOAA numbers, according to skeptical researchers who have dissected the data: They are inaccurate, the result of cherry-picking, computer manipulation and “best guess” interpretation. The agency kitchens have concocted warming global temperatures using a hard-to-follow recipe of thinning reporting stations, grid-box interpolation, temperature homogenization, and algorithmic ingredients blended into a tweak-on-the-fly computer program.
Veteran meteorologist Joe D’Aleo - a long-time critic of official global-warming statistics - says NASA and NOAA are manipulating the data, calling their actions the U.S. version of last year’s Climategate scandal. The Climategate brouhaha ensued when thousands of hacked (or whistleblower) e-mails were uploaded last November to the Web from Britains Climate Research Unit (CRU) in East Anglia and seen by millions of fascinated snoops. The revealing missives exposed scientific misconduct by top climate scientists and researchers, several of whom are now under investigation in Britain and the United States.
“The CRU has been ground zero for alleged scientific conduct, but other national weather centers, organizations, universities, and the U.S. global data centers at NOAA and NASA are complicit in the misrepresentation or manipulation of data to support the supposed [global warming] consensus,” says D’Aleo, who also heads ICECAP, the International Climate and Environmental Change Assessment Project.
What warming?
NASA and NOAA have several data-manipulation tricks in their global warming cookbook. But before eyeballing their recipe, here are few inconvenient truths that failed to make their way into the NASA and NOAA press releases. According to D’Aleo: “Global temperatures peaked in late 1990s, leveled off, and have been declining since 2001. All five official databases - NOAA’s NCDC, NASA GISS, Hadley CRU, University of Alabama at Birmingham (UAH), and Remote Sensing Systems (RSS) - confirm the decline.”
Satellite data and land-ocean data sets are diverging. Last year, NOAA announced that June global temperatures ranked the second-warmest in 130 years, while the two satellite data sources—UAH and RSS --ranked the month’s temperatures the 15th and 14th coldest, respectively, in 31 years of record-keeping. In 2009, all regions of the United States were normal or below normal except for the Southwest and Florida, according to the NCDC.
The annual temperature in 2008 was the coolest since 1997, according to NOAA. Thirty-seven of 50 states set their all-time record temperatures in the decades prior to 1960.
According to the NCDC, 1936 experienced the hottest overall summer on record in the continental United States. In fact, out of 50 states, 24 recorded their all-time high temperature during the 1930s. The 2000s had the most benign weather, in terms of records (heat and cold), of any decade since the 1880s.
According to the Danish Meteorological Institute, arctic temperatures are currently below minus 31.27 degrees, more than five degrees below normal and the lowest since 2004. Last year, Chicago experienced its coolest July 8 in 118 years, and only four days during the summer reached the 90s. Six states experienced their coldest-ever July in 115 years, four the second coldest and two the third coldest. October was the third coldest and December the 14th coldest in the United States in 115 years.
Global warming and cooling are cyclical. Data show it warmed from 1920 to 1940 and again from 1979 to 1998. But temperatures cooled from 1940 to the late 1970s, and have been cooling since 2001. Since World War II, CO2 has risen, even as temperatures have cooled, warmed and then cooled again, undermining the theory that CO2 is the single most important cause of climate change.
Not a single official computer model predicted the recent decline (since 2001) in global temperatures. Yet extended projections from the same models are referenced by eco-alarmists demanding draconian CO2-emission controls and the imposition of carbon taxes and cap-and-trade restrictions.
See more on on the NOAA and NASA recipe and how they cook the books here. See the detailed SPPI paper here and E.M. Smith’s post here. See also John Coleman’s KUSI special which covered this topic here and the interview with E.M. Smith here. See some answers to NOAA and NASA rebuttals here (fuller response coming today). Scroll down to see the point-by-point responses.
NOAA versus NASA: US Data
By Steve McIntyre, Climate Audit
Anthony has a post reporting NOAA’s 2008 results, with NOAA reporting:
For 2008, the average temperature of 53.0 degrees F was 0.2 degree above the 20th Century average.
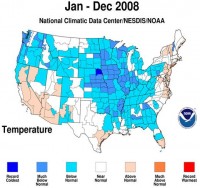
Enlarged map here.
Anthony showed the following image from NOAA (enlarged here):
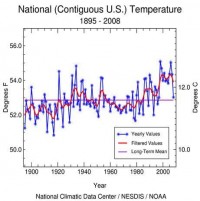
Readers need to keep in mind that there is a substantial “divergence” between NOAA US and NASA US temperatures as shown in the graphic below. Since 1940, NOAA’s US has increased relative to NASA’s US at a rate of 0.39 deg C/century, thus 0.27 deg C since 1940.
Figure 2. Difference (deg C) between NOAA US and NASA US temperature anomalies (enlarged here).
At present, we don’t know very much about the NOAA calculation. To my knowledge, they make no effort to make a UHI adjustment along the lines of NASA GISS. As I’ve mentioned before, in my opinion, the moral of the surfacestations.org project in the US is mainly that it gives a relatively objective means of deciding between these two discrepant series. As others have observed, the drift in the GISS results looks like it’s going to be relatively small compared to results from CRN1-2 stations - a result that has caused some cackling in the blogosphere. IMO, such cackling is misplaced. The surfacestations results give an objective reason to view the the NOAA result as biased. It also confirms that adjustments for UHI are required. Outside the US, the GISS meta-data on population and rural-ness is so screwed up and obsolete that their UHI “adjustment” is essentially random and its effectiveness in the ROW is very doubtful. Neither NOAA nor CRU even bother with such adjustments as they rely on various hokey “proofs” that UHI changes over the 20th century do not “matter”. See post here.
----------------------
December 14th Coldest, 11th Wettest for the United States
By Joseph D’Aleo
Note: Key West came within 1 degree of their all time record low with 42F. The coldest was 41F set in 1981 and 1886. In a southwest suburb of Miami (West Kendall Airport), it dropped to 26F this morning.
The average temperature in December 2009 was 30.2 F. This was -3.2 F cooler than the 1901-2000 (20th century) average, the 14th coolest December in 115 years. The temperature trend for the period of record (1895 to present) is 0.1 degrees Fahrenheit per decade (enlarged here).
See state by state ranking below (enlarged here).
2.88 inches of precipitation fell in December. This was 0.65 inches more than the 1901-2000 average, the 11th wettest such month on record. The precipitation trend for the period of record (1895 to present) is 0.02 inches per decade (see enlarged here).
After a cold first half of January, a “January thaw”, a singularity that appears most reliably in cold winters around the third week of January will overpread much of the nation the next week before cold weather returns late in the month. Snowcover will slow the surface warming (see enlarged here).
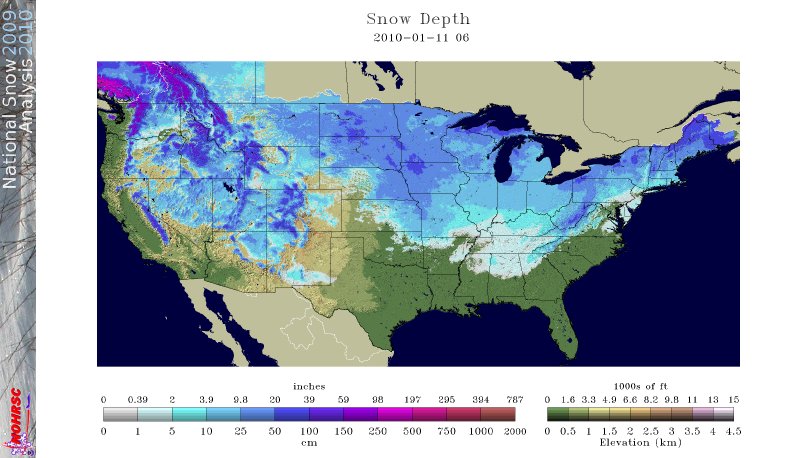
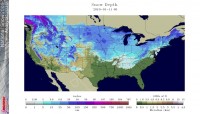
Globally, the snowcover is well above normal. (see enlarged here).
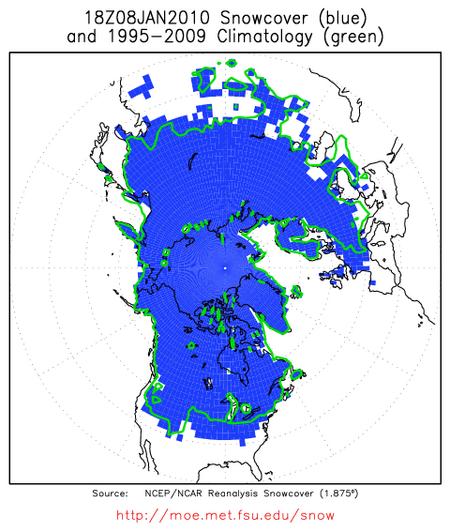

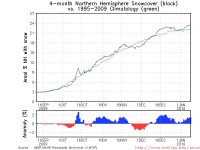
Enlarged here.
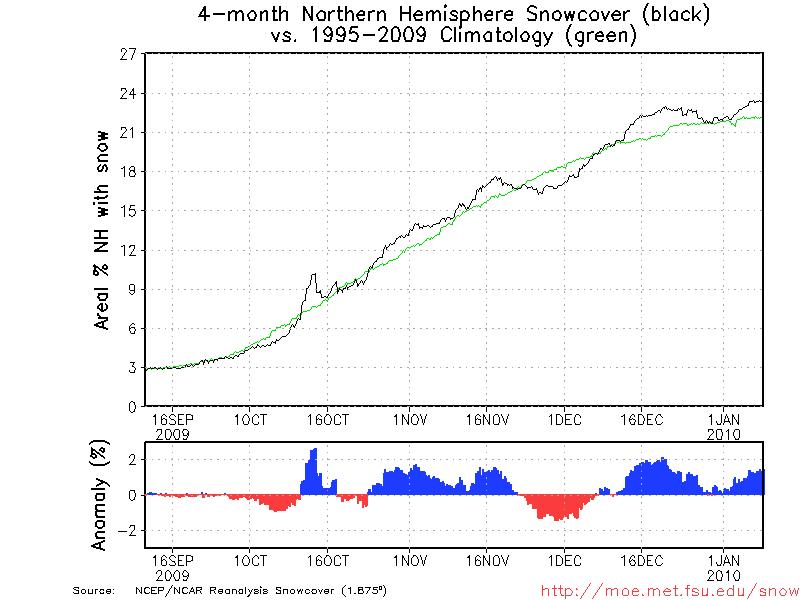
As often happens in winters when major blocking - arctic warming (negative AO) occurs in December, it eases briefly allowing for a more zonal flow and some brief moderation in the United States, western Europe and China for a few days then repeats again in mid to late winter. After this ‘January thaw the next week or so, expect more December like cold and snow, to reprise by late January and February. That should ensure the winter of 2009/10 will for these locations average among the colder winters in quite a while, even with the cooked data sets.
The Global Data for December and 2009
NOAA tells us: “The globe recorded its eighth warmest December since record keeping began in 1880, and 2009 tied with 2006 as the fifth warmest year on record, according to NOAA’s National Climatic Data Center. NASA’s Goddard Institute for Space Studies rated December 2009 as the 4th warmest December on record, and the year 2009 tied with 2007 as the second warmest year on record (in 135 years. NOAA rated December 2009 ocean temperatures as the 2nd warmest on record, next to 1997, and land temperatures as the 31st warmest on record. The anomalously cool conditions over much of northern Asian and North American land areas may be associated with the near record December snow cover extent over Northern Hemisphere land areas--2nd most on record, behind 1985. Snow cover records go back to 1967. The December global satellite-measured temperatures for the lowest 8 km of the atmosphere were the 7th warmest on record (in 31 years), according to the University of Alabama Huntsville and RSS data sets.